The Complete Ecommerce Analytics Toolkit: 29 Reports, 6 Actionable Steps + 2 Free Guides
There’s a quote out there that I use on a regular basis to level set with myself. I can’t find who said it first, but it rings true every single time I read it:
It isn’t about being the best. It’s about being better than you were yesterday.
What that quote gets at is the inherent value and upward trajectory that naturally comes along with incremental gains.
And incremental gains are the only way, in any industry or sector of life, that anyone achieves greatness.
In ecommerce, it means this:
You don’t have to outsell your competition today. You just have to outsell yourself tomorrow.
If you do that, if you can earn more sales, more loyalty and more market share each day after the next –– you will win. It’s the retold tale of the tortoise and the hare. Speed isn’t the virtue. Consistent movement toward an end goal is.
Unlike the hare, though, ecommerce business don’t have a physical road on which to gauge their progress –– or note their missteps.
That’s why ecommerce analytics are so incredibly important for online brands. It’s also why BigCommerce, in 2015, acquired Jirafe Analytics –– the ecommerce analytics industry leader with customers including:
Nasty Gal
Nikon
Diamond Candles
The goal was to provide BigCommerce customers with unparalleled insight into their on-site merchandising strategies to complement their Google Analytics information.
Today, we are excited to announce updates to the BigCommerce’s Ecommerce Analytics and Insights suite –– including increased data accuracy, streamlined user interfaces and easier to understand pricing.
Why We Updated Our Ecommerce Analytics + Insights Suite
Over the last 6 months, we’ve worked with BigCommerce customers in beta to update our ecommerce analytics data accuracy, pricing and usability. What we heard was this:
I need analytics I can understand in a glance. I’m not a data scientist. It can’t be complicated. It has to just tell me my story – reliably.
Based on that feedback, we have now updated the UX, data accuracy and resource guides for our 11 out-of-the-box analytics reports and 18 Insights reports customers can use on a recurring subscription payment modal. That’s a total of 29 total reports available to BigCommerce customers.
Let’s go over exactly what we did.
Data Accuracy
We’ve made enhancements to the ecommerce analytics suite to improve our data accuracy and help you better understand where and when data is being updated. Here is what you will now see.
Timestamps
All data in our out-of-the-box Ecommerce Analytics reports (except Real Time, Abandoned Cart Recovery, In-Store Search and Sales Tax Report) now include a timestamp so that you know exactly when the data was pulled last.
The time zone can be changed by editing the date settings.

Data within our Insights reports (an additional 18 reports that come at a subscription cost) are updated weekly or monthly, depending on the metric.
Important to note
You will see data discrepancies between your BigCommerce Ecommerce Analytics, Google Analytics and any other analytics tools you use.
This is because no two systems measure or collect data in the exact same way. Kissmetrics defines it like this:
Different systems = different methodologies = different metrics.
Items that affect accuracy include:
Product level versus site level versus customer level data
Time zones
Data refresh periods
Which traffic sources get credited
How an analytics tool identifies users (1st touch v. last touch, 1st party v. 3rd party cookies, etc.)
This is why we’ve made sure to include information on exactly what we measure, how, and how often.
How the Data is Calculated (+ Resource Guides)
We’ve aligned on industry best practices for data definitions –– and have renamed a few reports to reflect the most commonly used terms for that type of data set.
And, we’ve built out 29 charts to walk you through exactly how we have calculated the metrics that matter most to you.
For instance, here is exactly how we calculate everything on the Store Overview report:
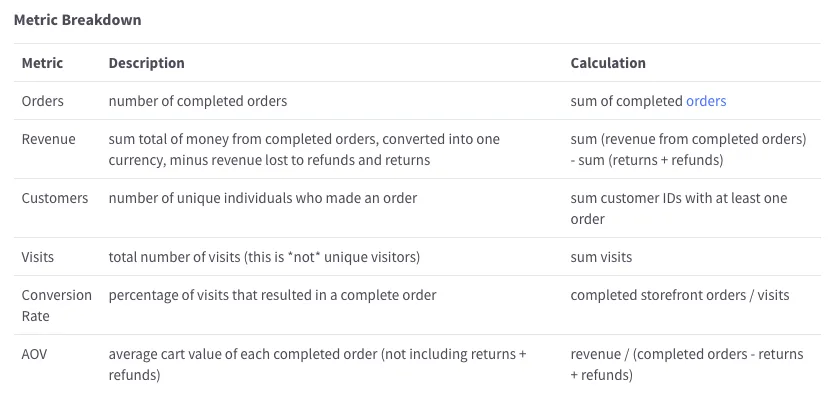
Visit the Store Overview Report KB page for more information.
All 29 reports have a chart similar to the one above. You can access the out-of-the-box report calculation detail pages here, and the Insights reports calculation detail pages here.
Get Your Free PDF of All Report Calculation Details
Want to keep how your analytics are calculated on hand at all times? Click here to get a PDF you can print and reference whenever you need it.
This PDF also includes the complete data definitions guide.
Ecommerce Analytics + Insights UX
All reports have received a UX scrub for increased usability, as well as have gone through user testing to ensure ease of use and functionality for all levels of business employees.
Free Ecommerce Analytics Reports
Here’s an updated view of the overview page of BigCommerce’s Ecommerce Analytics.
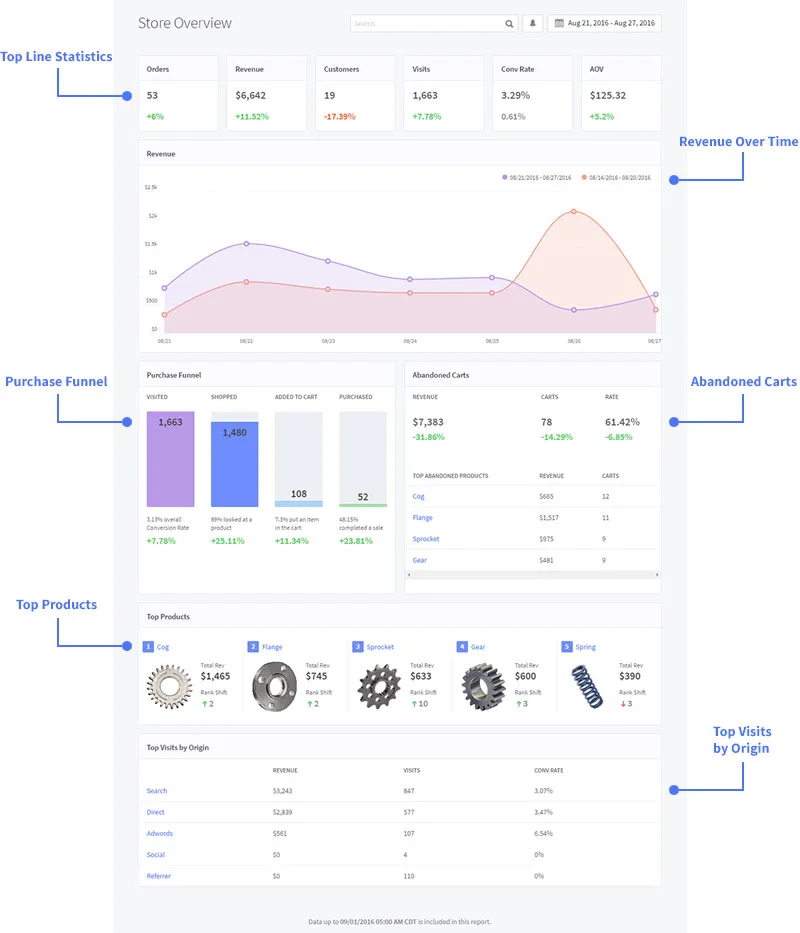
Additional out-of-the-box reports include:
Real-time
Merchandising
Marketing
Orders
Customers
Purchase funnel
Abandoned carts
Abandoned cart recovery
In-store search
Sales tax
BigCommerce Insights Reports
BigCommerce’s Insights reports received the most substantial facelift based on feedback from BigCommerce customers.
The Insights reports are sectioned out into 3 categories:
Product Insights
Customer Insights
Marketing Insights
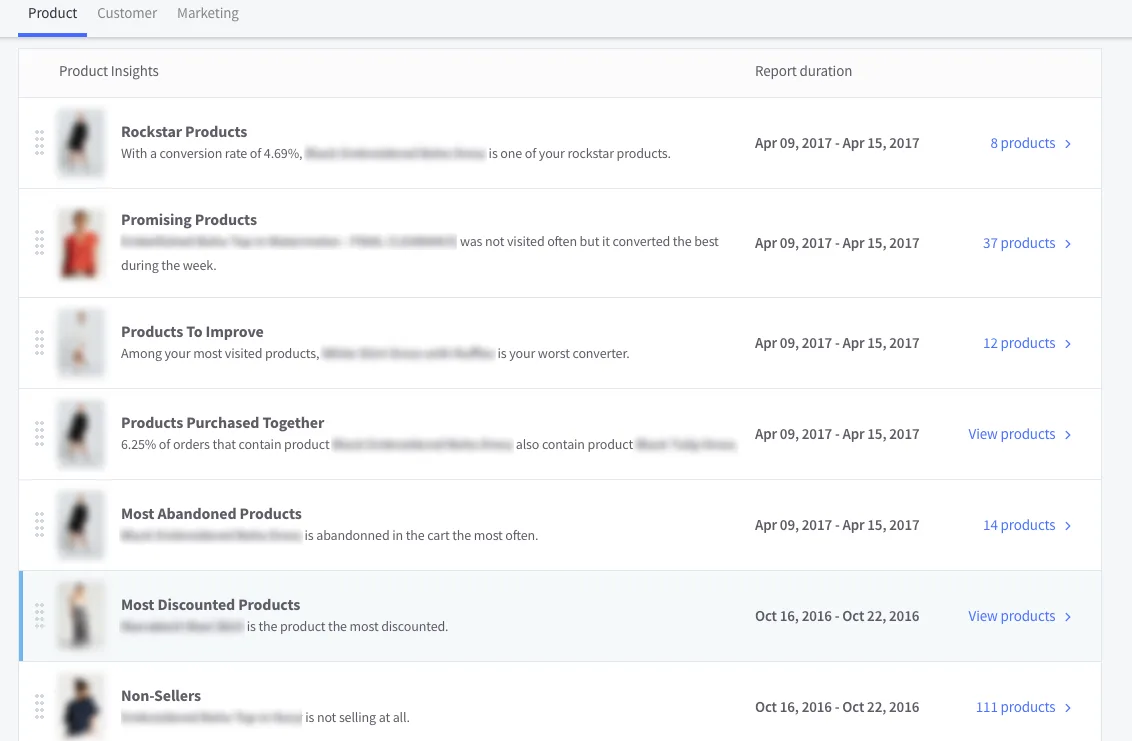
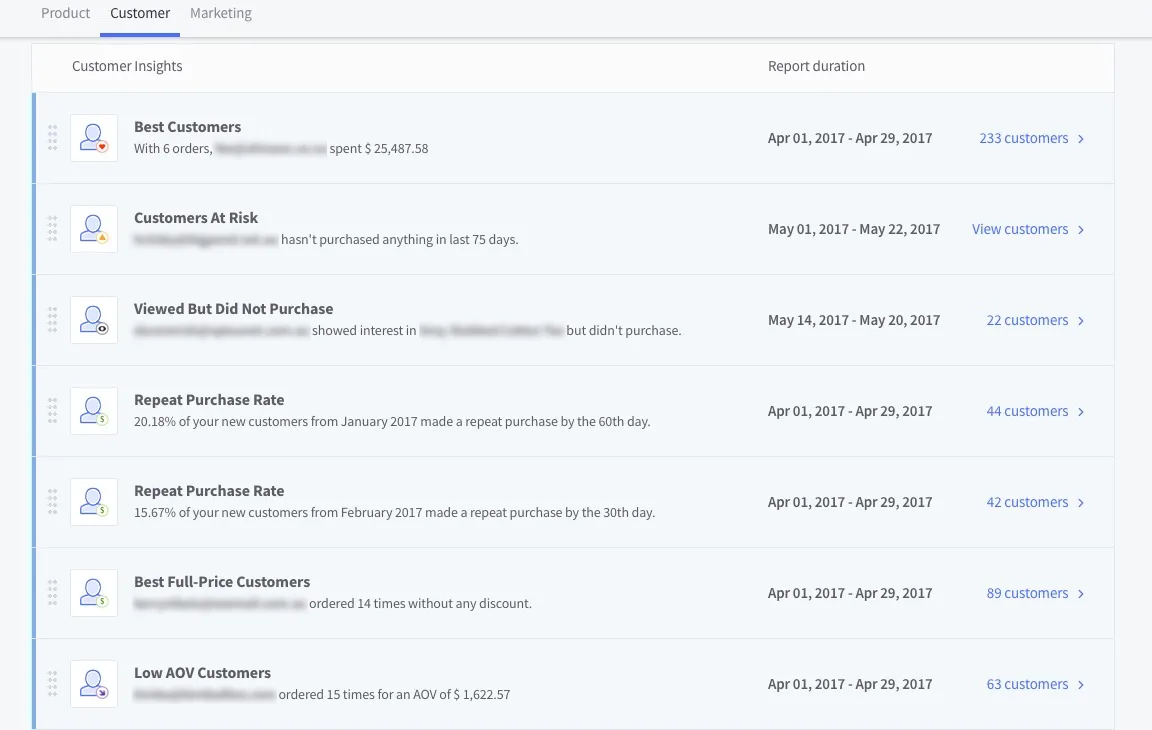
Here are what those now look like.
Product Insights
Customer Insights
Marketing Insights

We use BigCommerce Insights quite heavily on a day-to-day basis. In fact, it was a key motivator for us going with BigCommerce over Shopify.
We don’t have to pull data out of spreadsheets and sort it to see what is going on. What we can focus on doing instead is pulling the Insights data out into a CSV and tailoring campaigns to target specific customer segments.
How to Use Your Ecommerce Analytics + Insights Reports
Now, once you know that you have these reports handy, it’s likely you’re asking:
What now? What can I do with this information?
So glad you asked –– because so did we.
We worked with several BigCommerce customers over the last 6 months to uncover exactly how store owners, marketing managers and data teams use BigCommerce’s ecommerce analytics to make strategic decisions.
Here are the top 6 ways, and exactly how to do it.
Get Your Free Ecommerce Analytics Action Items Guide
Want to take the information below with you, show it off to your team, and begin the work to increase sales on your site? Download the free guide here.
1. Ecommerce Analytics to Power a Personalized Customer Experience
BigCommerce customers have access to merchandising and customer analytics by default. BigCommerce Insights are available to all customers for an increased fee each month (beginning at $49).
These analytics tools can help you to determine additional customer segments and cohorts for various personalization efforts. Here are a few ways to think through it.
Guest v. Registered Shoppers
Out-of-the-box BigCommerce’s Ecommerce Analytics gives you a Customer Report view recapping new and returning customers, as well as where those customers came from, which cohort they fall in (based on first purchase date), recent spend amount and total lifetime spend.
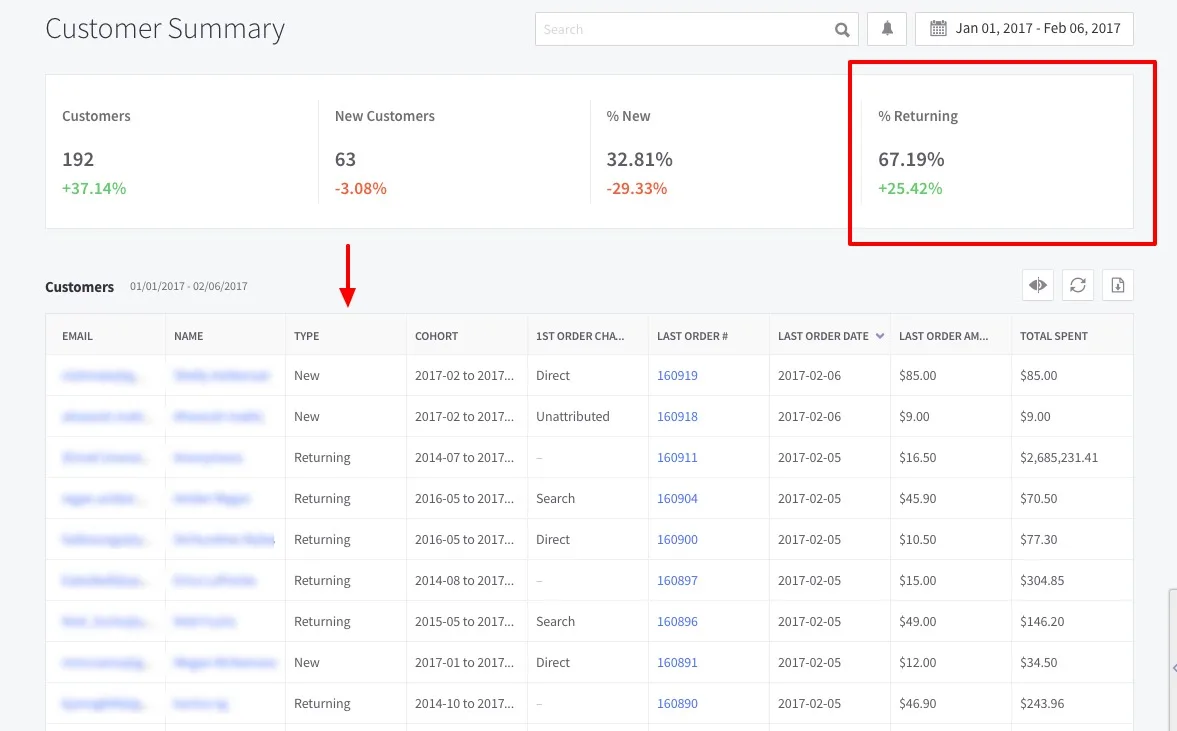
Number of Previous Purchases + Purchase History
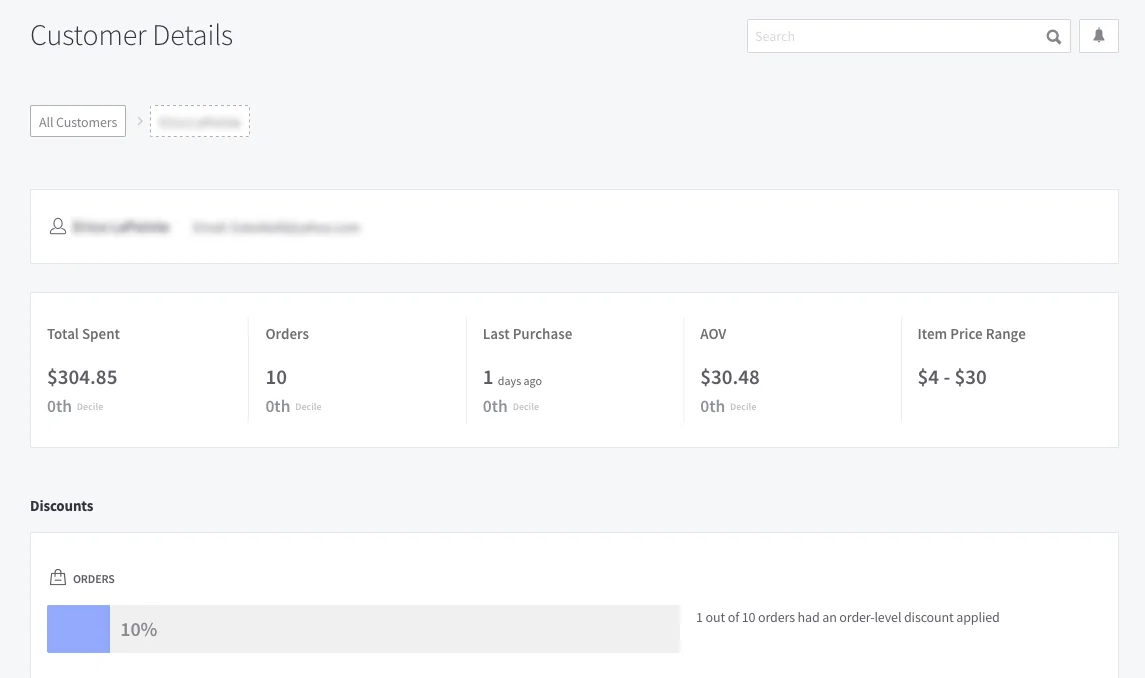
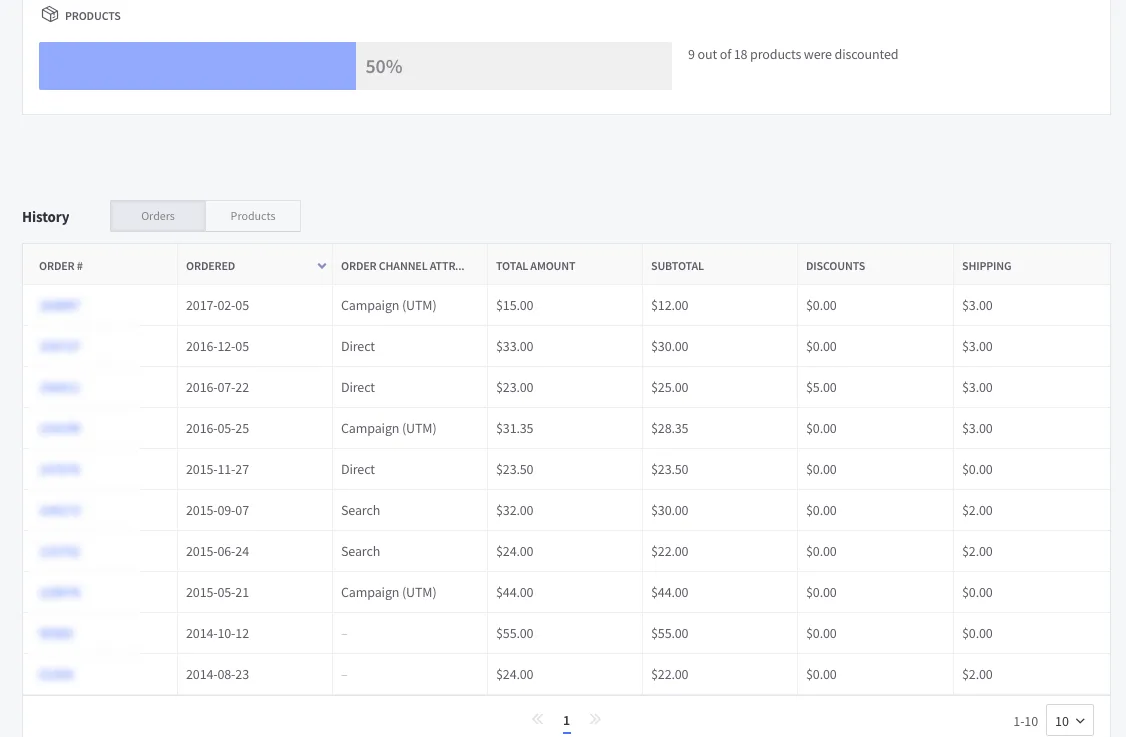
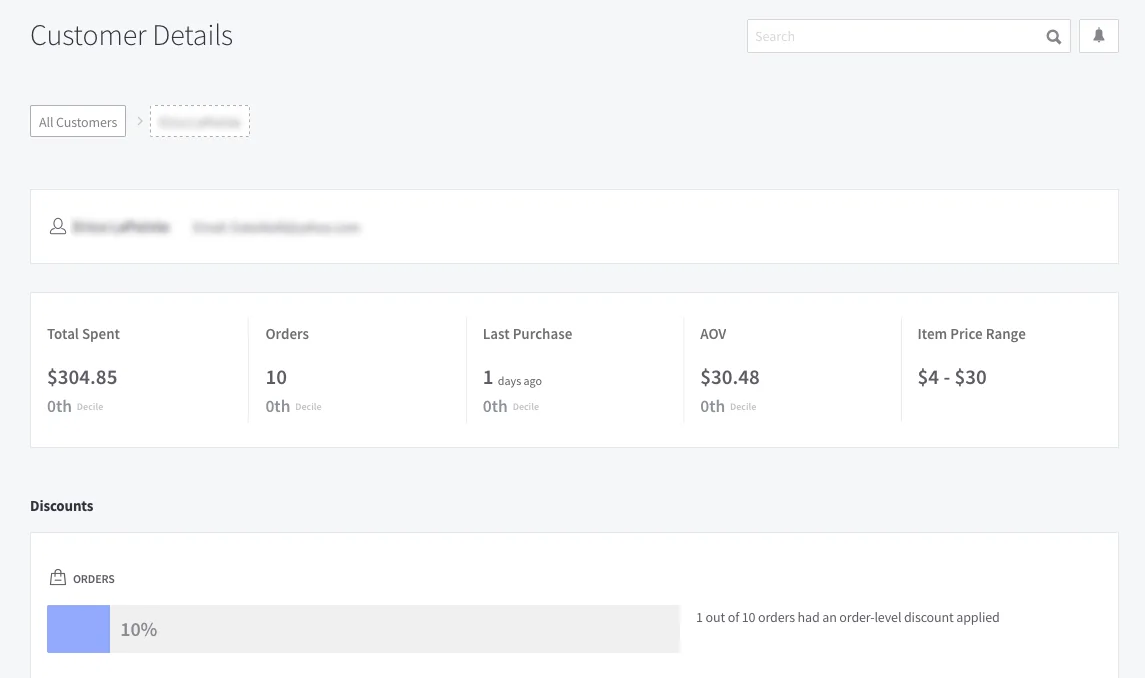
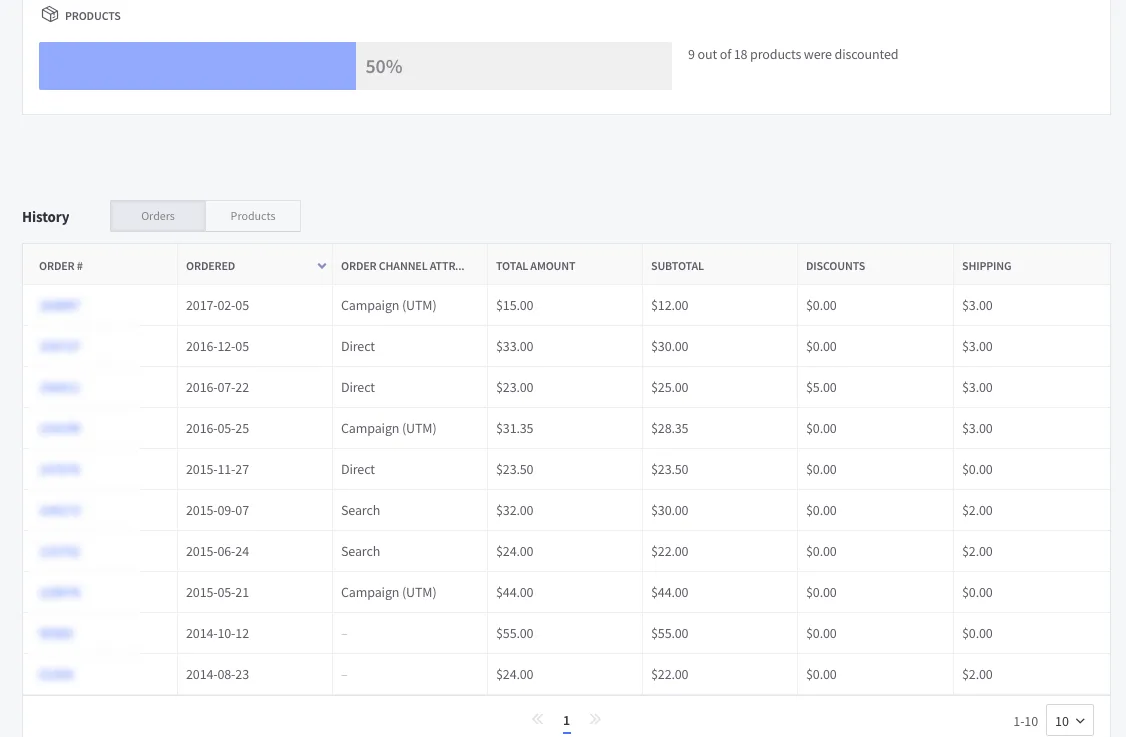
Out-of-the-box BigCommerce Ecommerce Analytics allows you to dove into individual customer reports to determine how often they are buying, what they are buying, any motivations for buying (discounts) and more.
Here you can also see which marketing channels are driving sales per customer. You can also get this by cohort.
Top Referral Traffic Source by Cohort
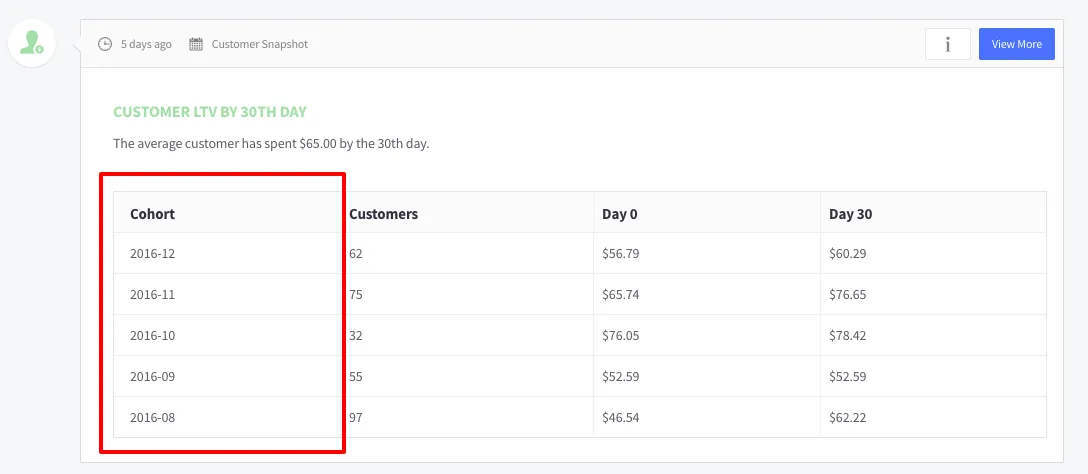
BigCommerce Insights allows brands to dig deeper into top customer conversion channels by cohort –– for 30, 60, 90, 180 and 360 day report views.
Typical Purchasing Habits
BigCommerce Insights allows brands to dive into customer cohorts beyond first-purchase, placing customers into cohorts based on activity and purchase habits.
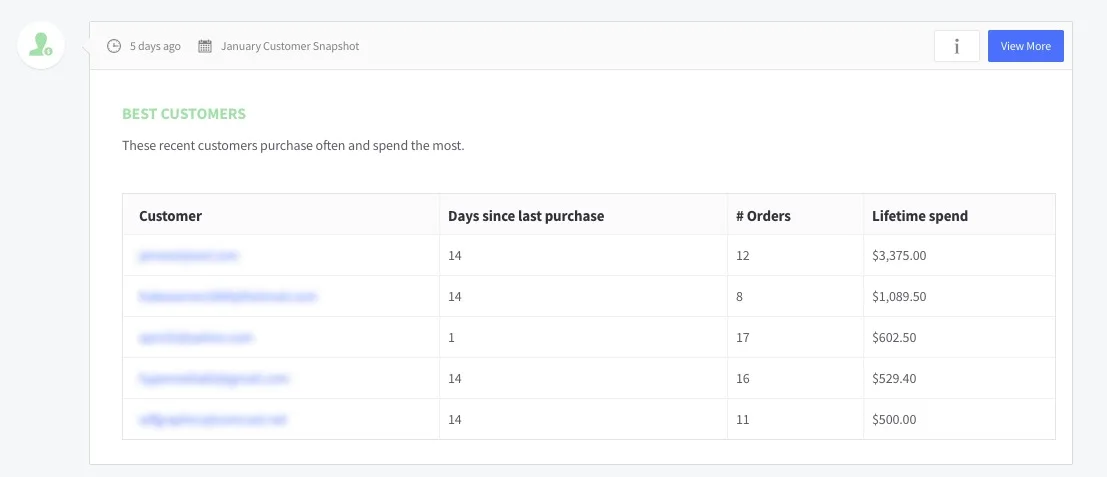
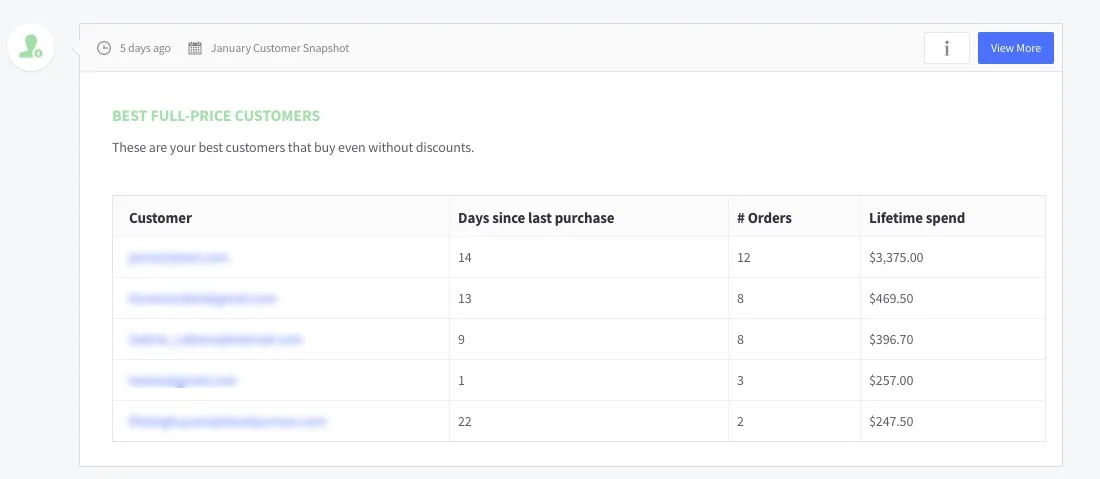
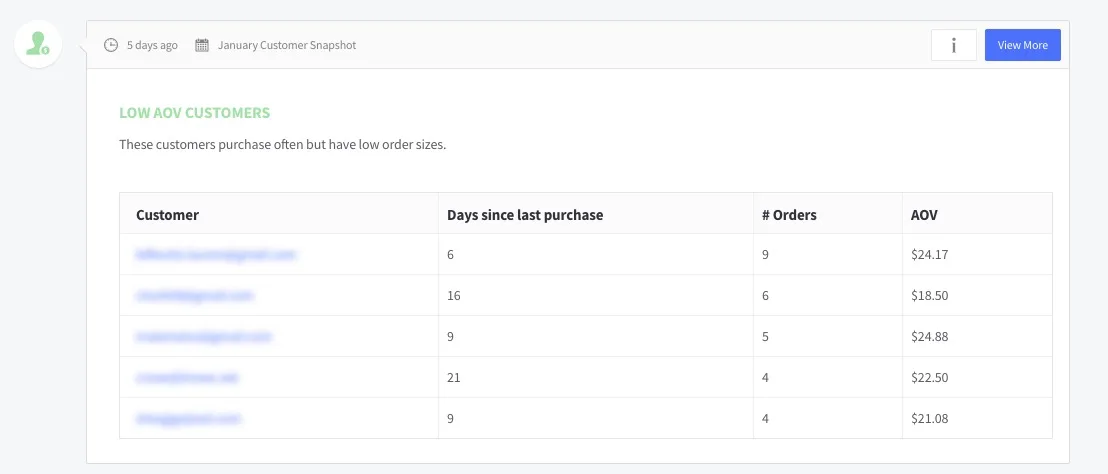
Best customers are determined by number of purchases over a given time frame. Other cohorts include Best Full-Price customers and Lowest AOV customers, so you can determine which cohorts to show discounts to versus which to send new product views and nurture streams.
Pages Viewed But No Purchase Made
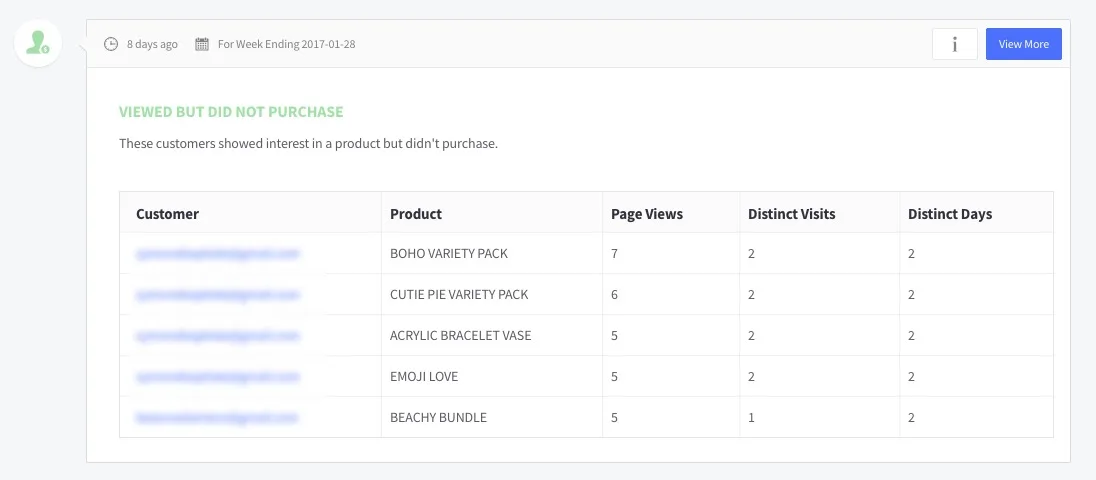
BigCommerce Insights gives you access to understanding which customers have viewed which pages, but haven’t added anything to cart or checked out. This allows you to personalize your outreach and understand which cohorts like which products, and why.
Once you are armed with the above data points as a foundation, advanced ecommerce personalization takes on three forms:
On-site targeting through modal pop-ups, header/footer banners, sliders, pop-unders and dynamic content blocks (UX)
Email driven 1:1 product recommendations, i.e. email automation
On-site personalized product recommendations using transaction oriented UX
The Complete Guide to Ecommerce Personalization
More personalization tips and how-tos to get you selling more online than ever before.
2. Ecommerce Analytics to Build an RFM Model
When you have optimized both the on-site and off-site experience for customers with a truly holistic and integrated personalization strategy, how do you discover your most valuable customers that bring in the highest conversion rate?
The RFM methodology is an acronym for the following three segments:
Recency is measured in days. You’d need to set a threshold meaningful to your business because the fewer the days from a customer’s last purchase the better.
Frequency is measured as the number of order per year from each customer. For some businesses, their best customers order monthly and for other replenishables-oriented businesses, their best customers order weekly.
Monetary analysis is the total order value over a period of time –– typically a over a year.
Marketers use the RFM model to filter out and score each customer by their most recent purchase by date (which is the ‘recency’ segment), by each customer’s number of orders (their purchase frequency) and then by their cumulative order value over a specified period of time (for the monetary analysis piece).
Each customer record should have the following fields in order to carry out RFM analysis for your store:
Total Order Value
Average Order Value
Total Number of Orders
Last Order Date
Value of Last Order
Date of First Order
Value of First Order
Average Number of Days Between Orders
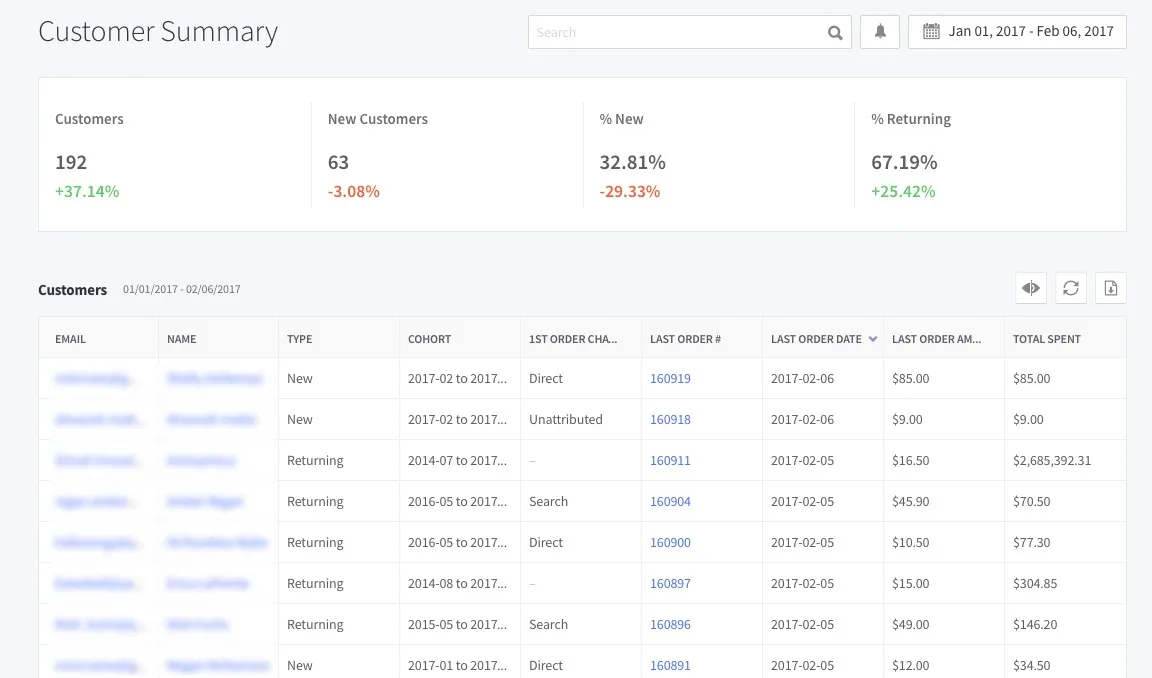
BigCommerce Ecommerce Analytics offers this view out-of-the-box.
Then, the output of an RFM analysis would look something like this (this is from OroCRM):
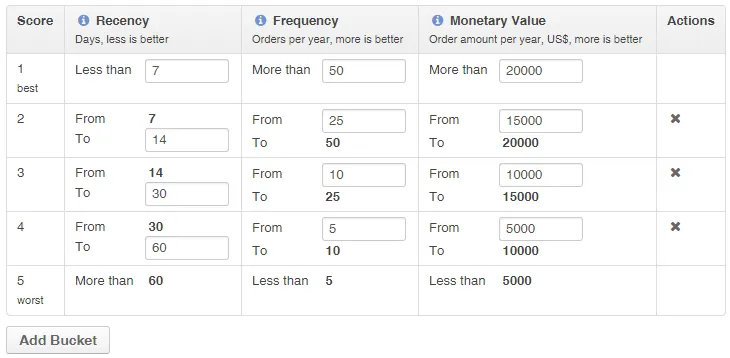
As you can see from above, the analysis is split out into 3 segments for recency, frequency and monetary value with points awarded to each segment.
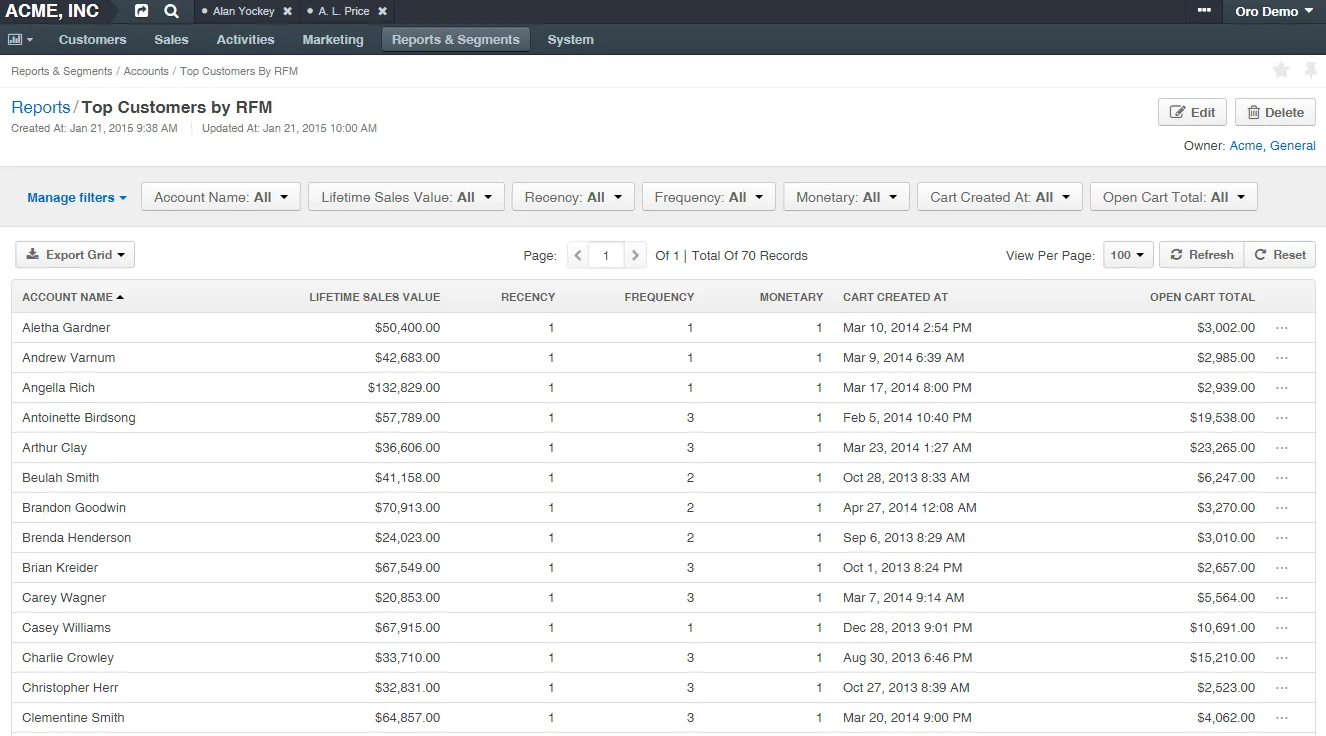
Image source: OroCRM
In the recency segment, this company designated the score of 5 to customers that have not ordered over the last two months.
In the frequency segment, customers that have made less than 5 purchases in the past year are also designated the score of 5.
And in their monetary value segment, customers’ whose cumulative spend over the past year has been less than $5,000 are designated the ‘worst’ score of 5.
Their highest rated customers are graded a top mark of 1 if they have made a purchase in the last 7 days, have had 50 or more orders in the past year and spent more that $20,000 over the past year.
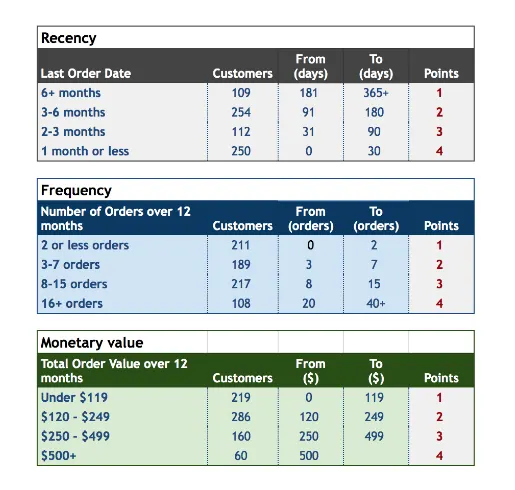
The spreadsheet above on the other hand gives lower numeric scores to top performing customers by recency (0-30 days), frequency (16+ orders in the last 12 months) and monetary value (total orders over $500).
Here are a few ways to use RFM scores to improve your marketing decisions and rules for 1:1 personalized email campaigns:
RFM scores should be used to create segments for personalization
Your RFM analysis will help you establish segments for existing customers such as high value customers, most active customers and newest customers.
By doing this, you are able to merge your revenue goals with better targeted unique messaging and personalized offers. RFM analysis can also help you create segments that identify inactive customers.
RFM scores should be calculated by channel
For multichannel retailers, RFM scores should be calculated by channel in order to better understand the quality of customers per channel.
BigCommerce Ecommerce Analytics offers a per customer view of last touch channel before conversion for all repeat customers. This data can be exported to give you a solid view of repeat customer purchase value by channel.
Integrate RFM scoring into your shopping cart abandonment strategy
RFM scores could be used to determine the incentive value threshold you are willing to offer customers that have recently abandoned their shopping carts.
As an example, higher value customers with order totals above a set threshold could be given steeper discounts to complete their purchase.
Here are your 3 types of customers according to the RFM model:
1.High recency, high frequency and high monetary
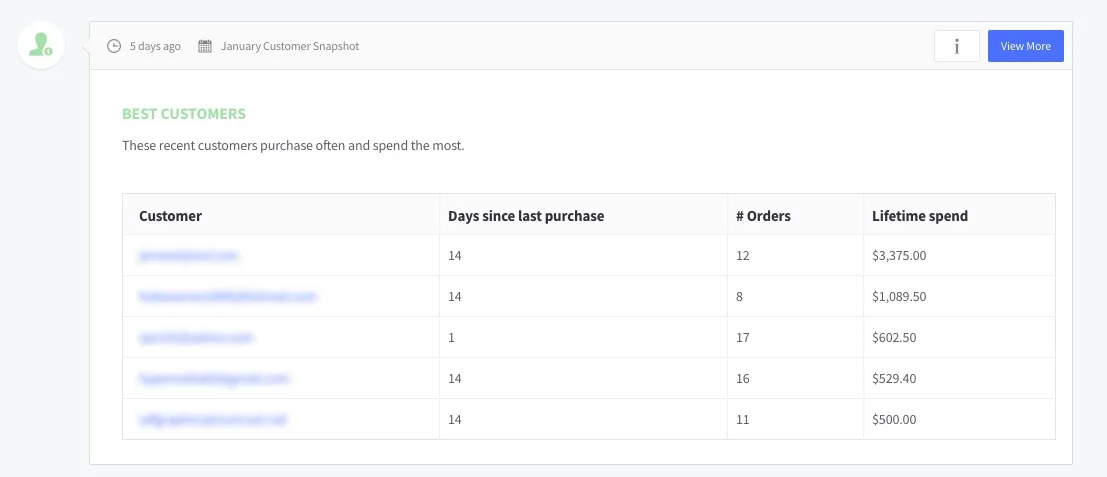
Customers scoring highest for recency, frequency and monetary value will be in your most loyal customer segment and should be rewarded with exclusive offers and special privileges.
For example, shipping could be free to your best customers. Here is the BigCommerce Insights view of this cohort.
2. High recency, low frequency and low monetary
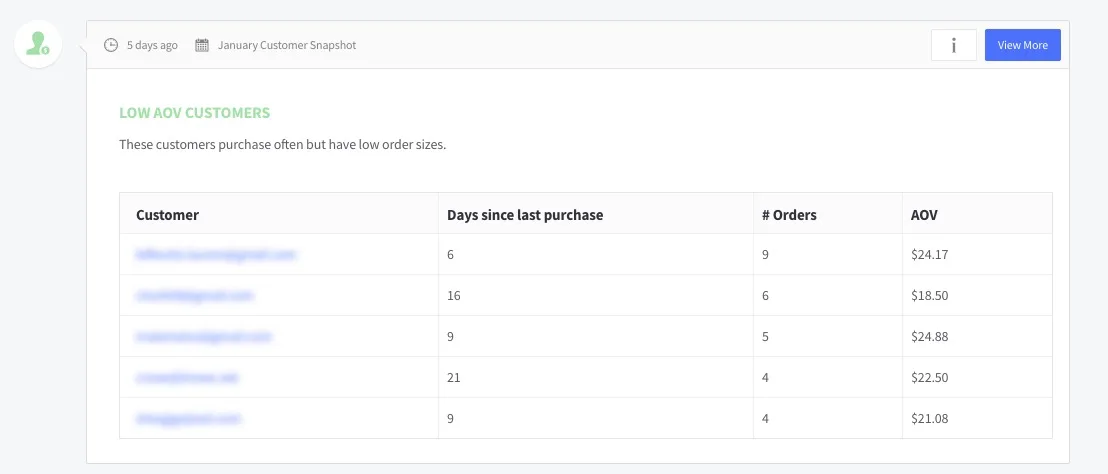
Customers in this segment will most likely be your newest customers. Make sure you put your best foot forward, by sending them welcome offers, product-guides or relevant information to get them accustomed to your brand and store.
Here is how BigCommerce Insights depicts this cohort.
3. Low recency, low frequency and low monetary
These will be deemed your inactive or least engaged customers. You would either want to attempt to re-activate them or double-check to see if they should remain on your list as customers.
55 Ecommerce Metrics + KPIs to Grow Revenue
Plus, a handy chart! Get it here.
3. Ecommerce Analytics to Build High-Converting Product Pages
You want more sales –– and need a strategy for how to get them.
Rather than throwing advertising dollars behind marketing channels and driving customers to landing pages you *think* they will like, BigCommerce’s ecommerce analytics allows you to dive customers to pages you know convert well –– and increase lifetime value.
Customer we spoke with used ecommerce analytics to focus on the highest-value cohorts on their traffic.
These are not only the prospective and current customers you have invested your budget toward, but they are also the individuals you know you can motivate to take productive action with your business.
But, how do you identify the most valuable traffic to your business?
Start by diving into your website analytics, specifically looking into your top traffic sources, not only from a traffic volume perspective but also from a revenue perspective.
These sources typically include:
Email
Paid Search
Organic Search
Direct
Here is where you can find that information in your free ecommerce analytics reports.
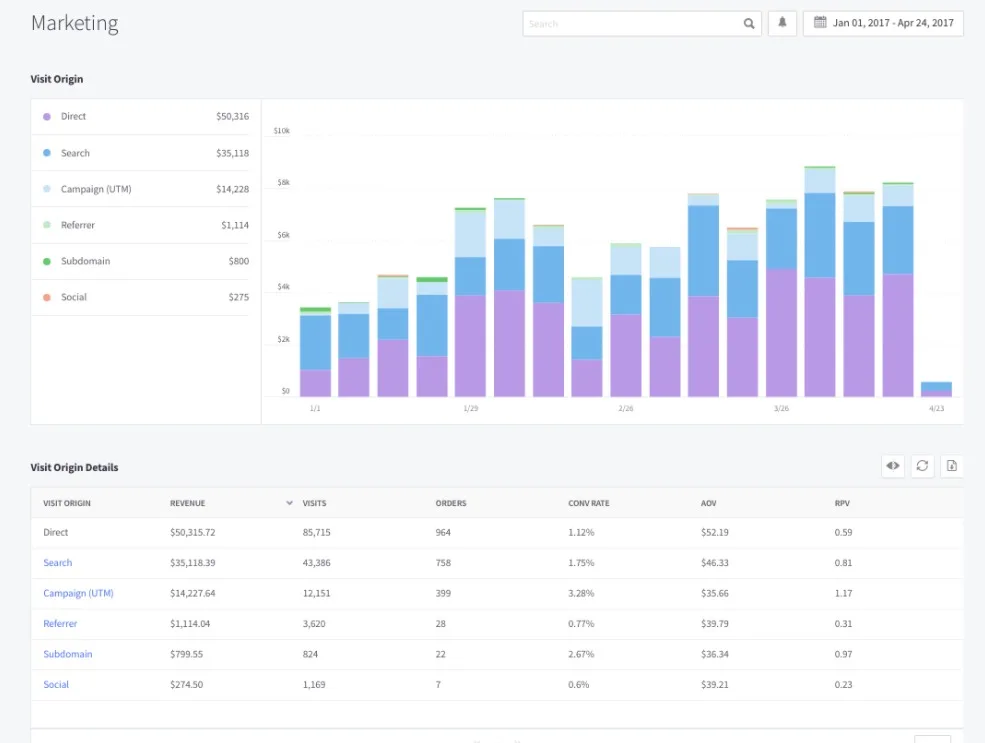
Once you have pinpointed those top traffic sources, dig even deeper and look at the specific campaigns responsible for driving that traffic.
Ask yourself:
Do those jumps in traffic arise from specific marketing emails or promotions?
Are they a result of cart abandonment ads on Facebook?
Are there specific search terms you have ads for that are just killing it for you?
By sifting through all of these details, you’ll be able to get a clear understanding of which specific cohorts of traffic are the most valuable to your business.
Then, double down on those channels for look-a-like cohorts to drive net new customers.
Want to target already existing customers, build lifetime value and customer loyalty? That’s what the Insights Reports do for you. Here is a taste.
Marketing Insights Reports
In this section, you can dive into customer lifetime value by channel on day 1, 90 and 180. This will help you understand which channels (AdWords, Email, Facebook, etc.) drive the highest lifetime loyalty and repeat purchase rates.
What is this helpful for? It helps you understand where to put your ad dollars to drive consumers back to your product landing pages for purchases that ultimately will result in higher lifetime customer value (LTV).

Above are the three reports you get, as you saw earlier in this article. Below is what it looks like when you dive into one of those reports. All reports allow you to download a CSV if you prefer to work with the data in a spreadsheet.
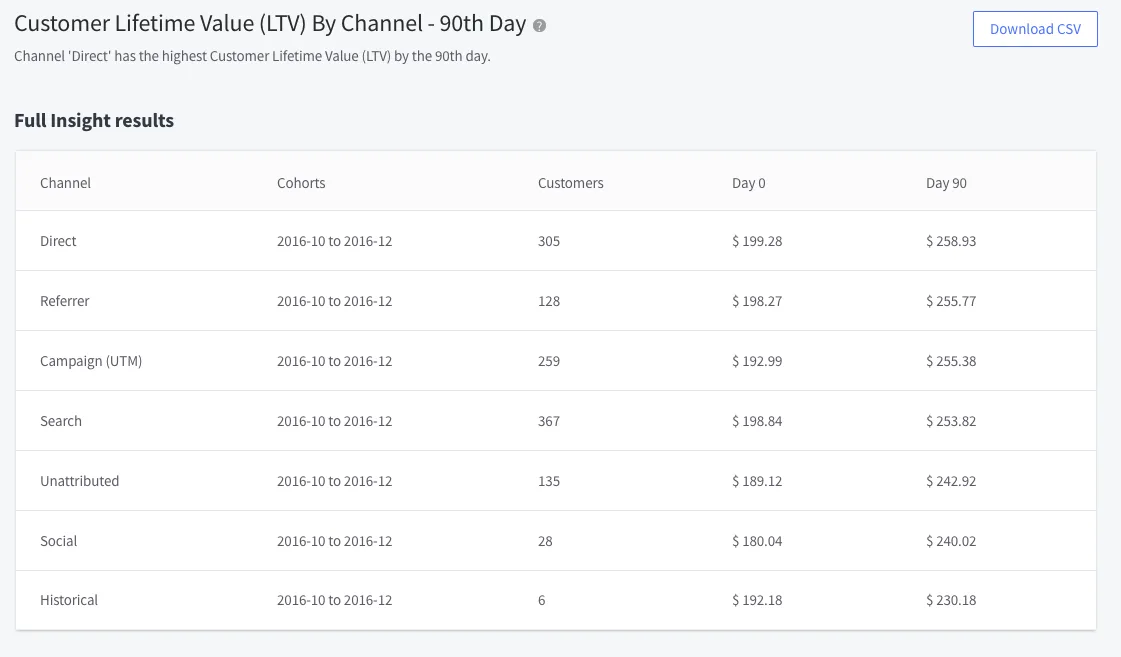
Here is what the 90 day report looks like, and how you can download the data to further investigate.
Product Insights Reports
Here, you can dive into which products (and subsequently product landing pages) are performing the best, and which need a little work.
This data is pulled based on individual product conversion rate data. So, if its a rockstar product, it is likely a rockstar landing page.
Further, you can use this data with the Marketing Insights data to understand which products to market for the highest return on ad spend.

Finally, you can use these insights to see which products are bought together most often. This is a good indicator of what additional products to include on product or landing pages for upsell opportunities.
Customer Insights Reports
With these reports, you can dive into various customer cohorts including:
Best customers
Customers at risk
Low AOV customers
Customer lifetime value (30, 90, and 180 days)
Customer lifetime value by product (day 1, 90 and 180)
Best products for repeat purchase (By month)
This data is helpful for understanding customer behavior on your site, which products drive loyalty and creating product pages that best attract high AOV and full-price customers.
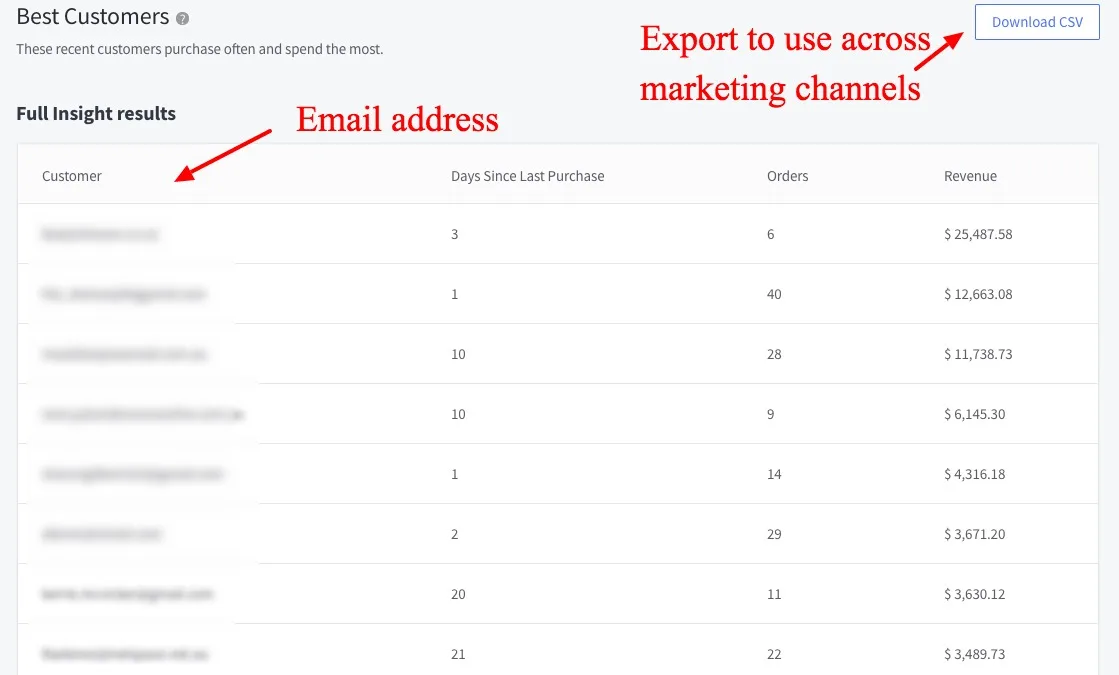
Most useful, however, is to use this data for retargeting on Facebook, Instagram or various channels to earn more “Best customers” using already known characteristics of that cohort.
You saw above how many Customer Insights reports you have available to you. Here is what a dive into the Best Customers report looks like:
Email Marketing Tactics That Don't Work
Noah Kagan gets detailed about which of his 100M emails performed, which didn’t, and what that teaches us.
4. Ecommerce Analytics to Know Your Customer (Much) Better
Always consider who your business is being built for. Remembering the wants and needs of the consumer will dictate your actions as a company and set you on the path of success with your audience.
If you’re unsure about who your audience is, you’re not alone.
All too often, many brands forget their audiences and focus on the product or the catalog, potentially missing out on valuable information that can increase sales.
This can be remedied.
Take the time to truly reflect on your past purchasers. Look for trends in the analytics and reflect on experiences you’ve had with your customers.
Your analytics can be very helpful directionally in helping you understand your customer and their relation to your product and brand.
Looking at your store’s overview data, including abandoned cart data, purchase funnel and most popular products is a great place to start.
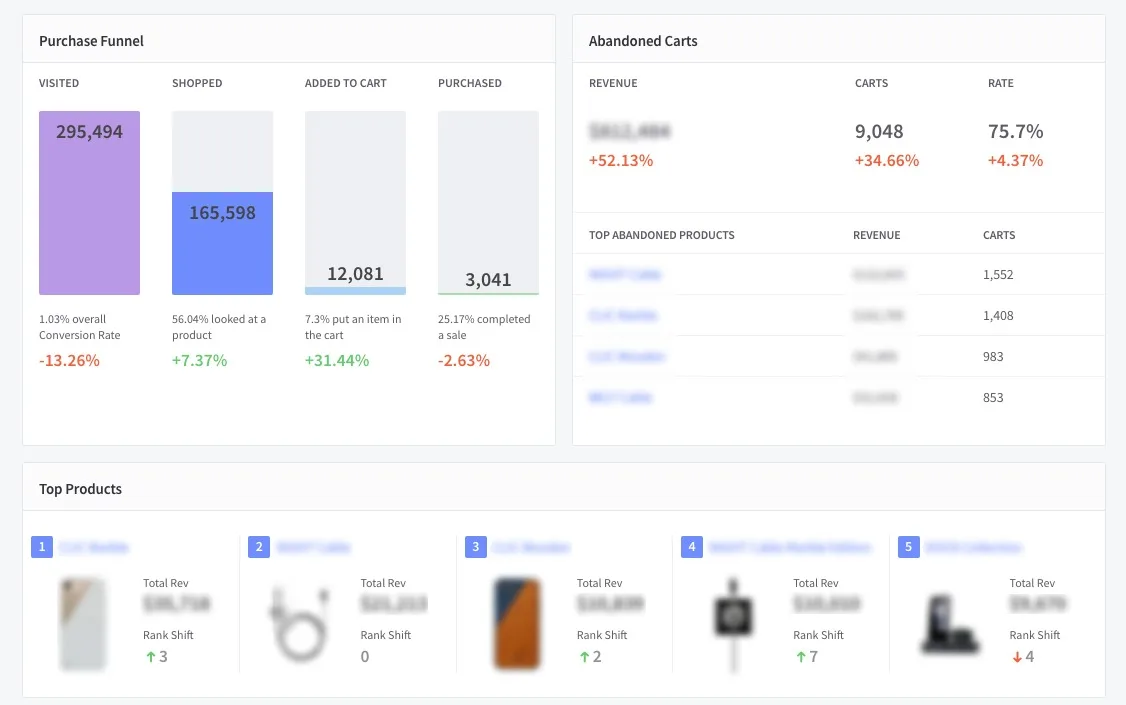
However, it’s helpful to dive into your customer data even further to really understand their behavior and who they are, enabling you to personalize their experience.
Ecommerce Insights can help you to do this. BigCommerce’s Ecommerce Insights cohorts customers for you automatically.
You can then export these lists to market specifically to them or to drill down even further into exactly who falls into these categories, what they’ve bought, etc. This segmentation is truly the key to unlocking the potential of your ecommerce brand.
The Customer cohorts include:
Best customers
Customers at risk
Viewed by didn’t purchase (both the customer who viewed and the items they didn’t purchase)
Repeat purchase rate by 30, 60, 90 and 180 days (i.e. 11% of your new customers from December purchased again in 60 days. 3.39% of your new customers from January 2017 purchased again in 30 days, and so on)
Best full-price customers
Low AOV customers
Customer Lifetime Value by 30, 90 and 180 days
Customer lifetime value by product purchase by day 1, 30, 90 and 180
Best products for repeat purchase
In this instance, I wanted to know which of my customers are sticking around the longest, and which products are helping them to do that.
To see that, let’s take a quick look at Best Product for Repeat Purchase report.
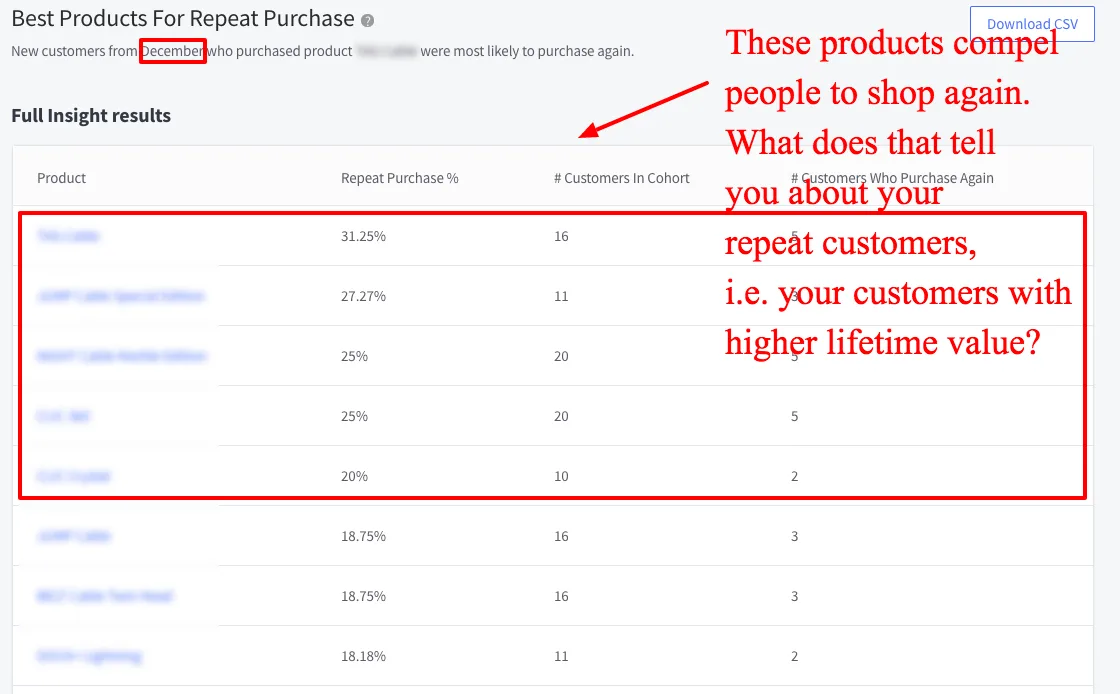
This is the cohort view for those who purchased in December, and again by March.
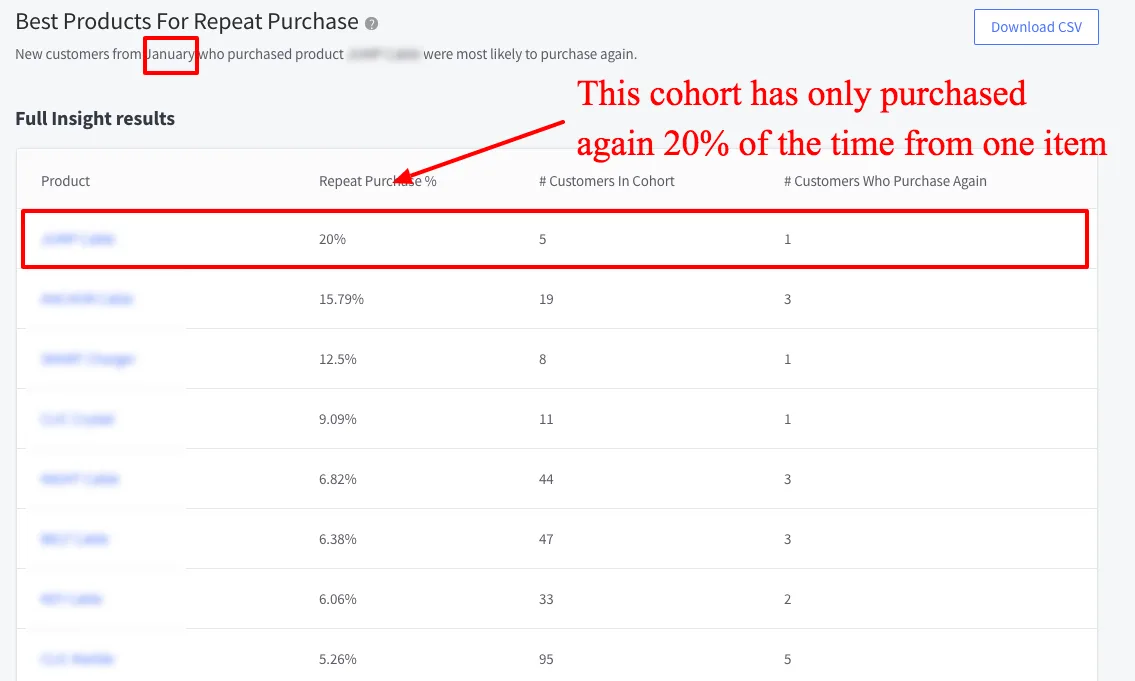
This is the cohort view for those who purchased in January, and again by March.
What can this data tell you about your customers and your brand?
Is it that customers buy with you again at the 90 day mark?
Or, are your customers most often gift-buyers, meaning they drop off in January and don’t repurchase until the next major holiday (maybe Mother’s Day or Father’s Day)?
Those are questions only you can answer, and often, you will need more data to do so. But these analytics point you in the right direction and get you asking the correct questions so you can better serve your customers, increase your revenue and develop your ecommerce brand.
Use these to look for patterns that clearly point to the heart of your business, that is, why people buy your products.
Take these buying behaviors and their demographics, you can reverse engineer your ideal customer.
How to Master Facebook Advertising Like an Equity Pro
5. Ecommerce Analytics to Earn Back More Than 15% of Abandoned Carts
Let’s be honest here –– BigCommerce’s out-of-the-box abandoned cart emails aren’t the prettiest. But, they do work well.
“We use BigCommerce’s Abandoned Cart feature. We’ve tried some other ones, too,” says Doug Root, CEO of Atlanta Light Bulbs explains it best. “That’s the thing. The abandoned cart feature on BigCommerce works functionally really well, but it’s just not as sexy as some of the other ones with making some cool graphics or doing some cool stuff. It is one of the best I’ve found in that it gets the best results, however.”
One of the biggest benefits of using BigCommerce’s free, out-of-the-box abandoned cart email is that all data is captured in your store backend.
Any store using BigCommerce, regardless of their email provider, gains access to their Abandoned Cart report data.
Here is what those look like:
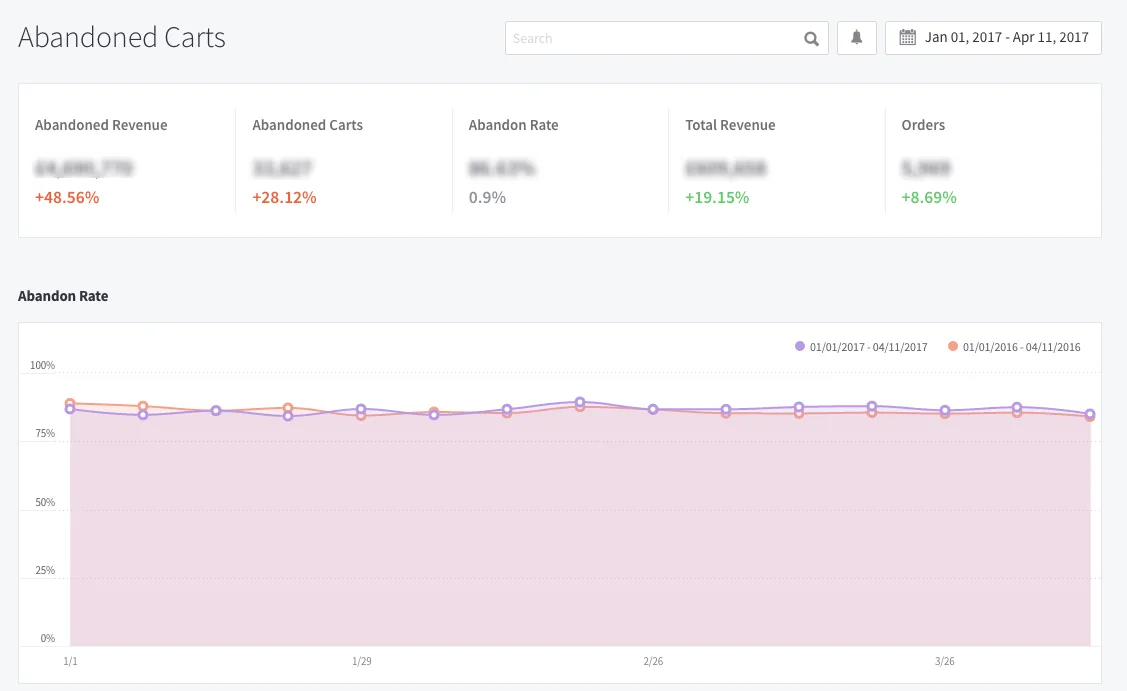
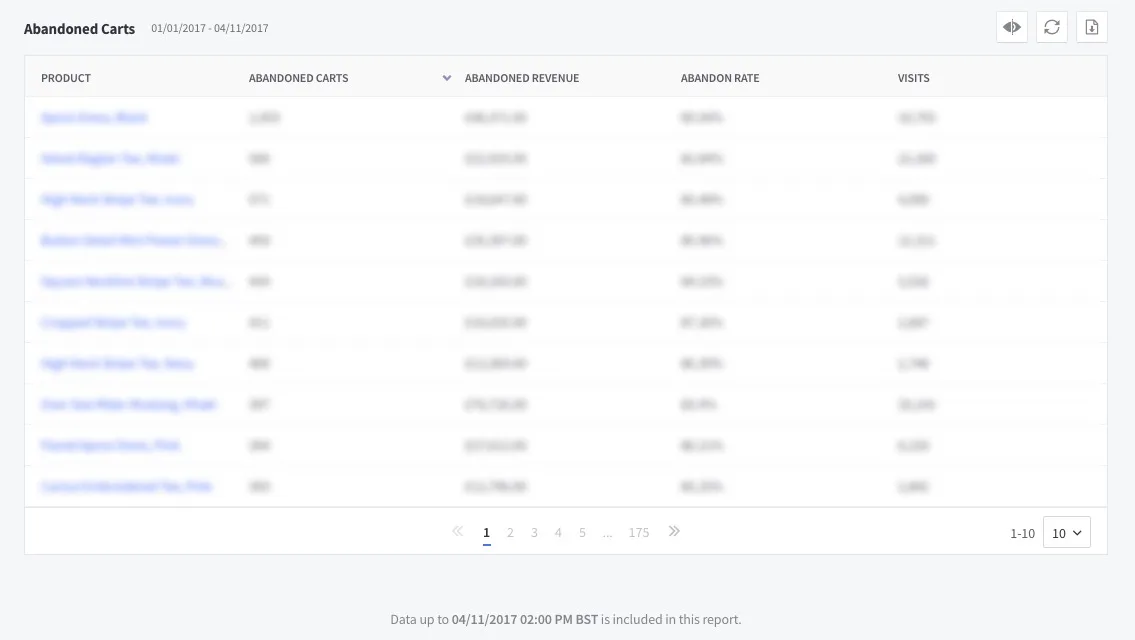
When using BigCommerce’s abandoned cart email tool, however, you also get access to email performance overtime.
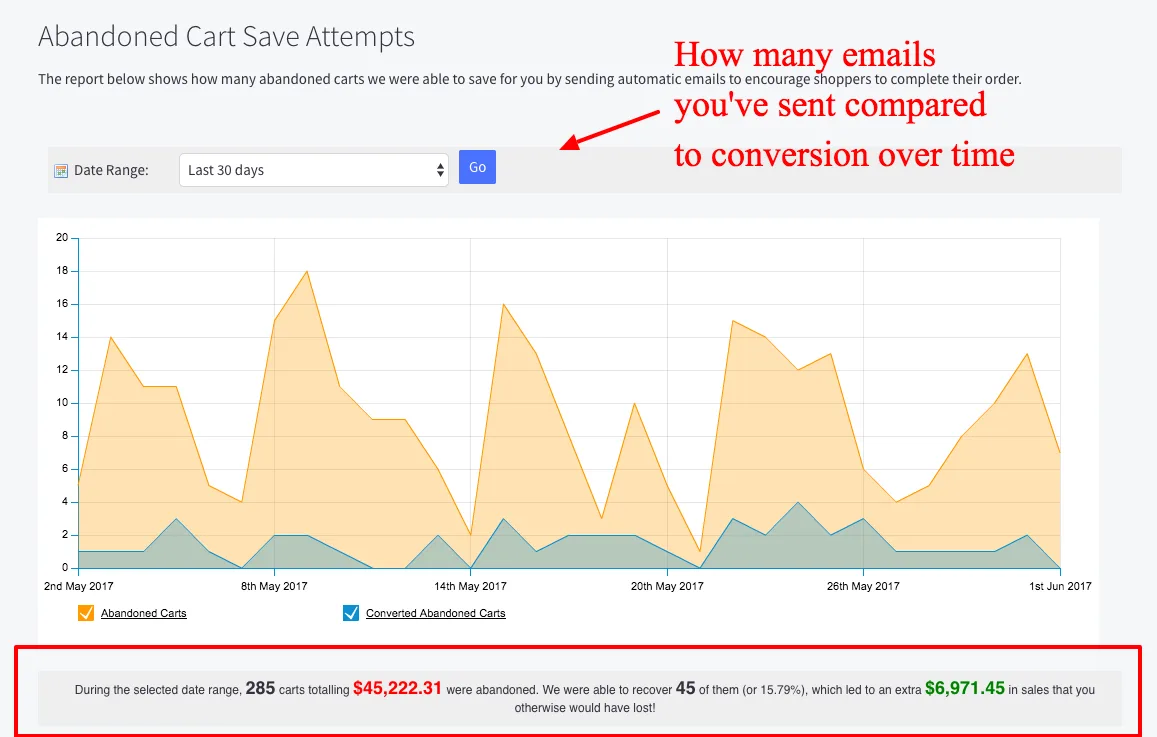
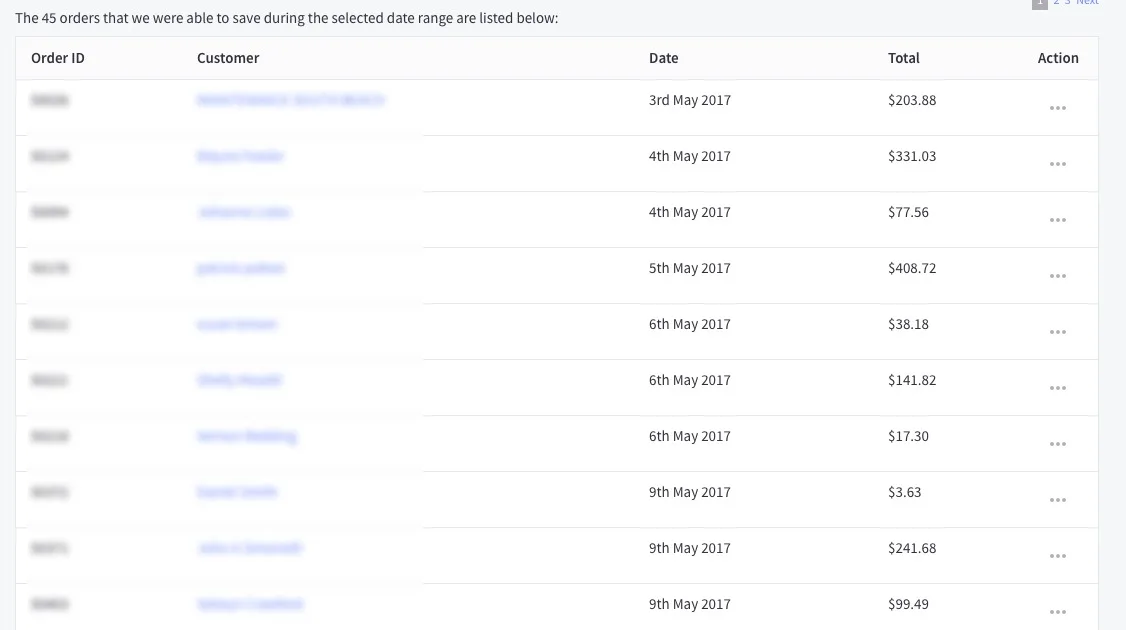
You also get access to which products people have come back to purchase, which allows you to understand which products are abandoned and the bought most often.
Why is that helpful? It might mean that the product’s price is too high (if abandoners are coming back to purchase with a discount, for instance), or that the product itself has a longer decision timeline before someone converts. The latter is often the case with higher priced items.
The Math Behind Abandoned Cart Email Success
On average, 15% of abandoners come back and buy. Some brands see up to 30%. Here’s how.
6. Ecommerce Analytics to Merchandise and Write Your Way to More Sales
There are also analytics on In-Store Searches that will show you what customers are typing into the built-in BigCommerce search tool.
This underutilized conversion optimization tactic helps you bridge the gap between what your customers are looking for and your on-site language and content.
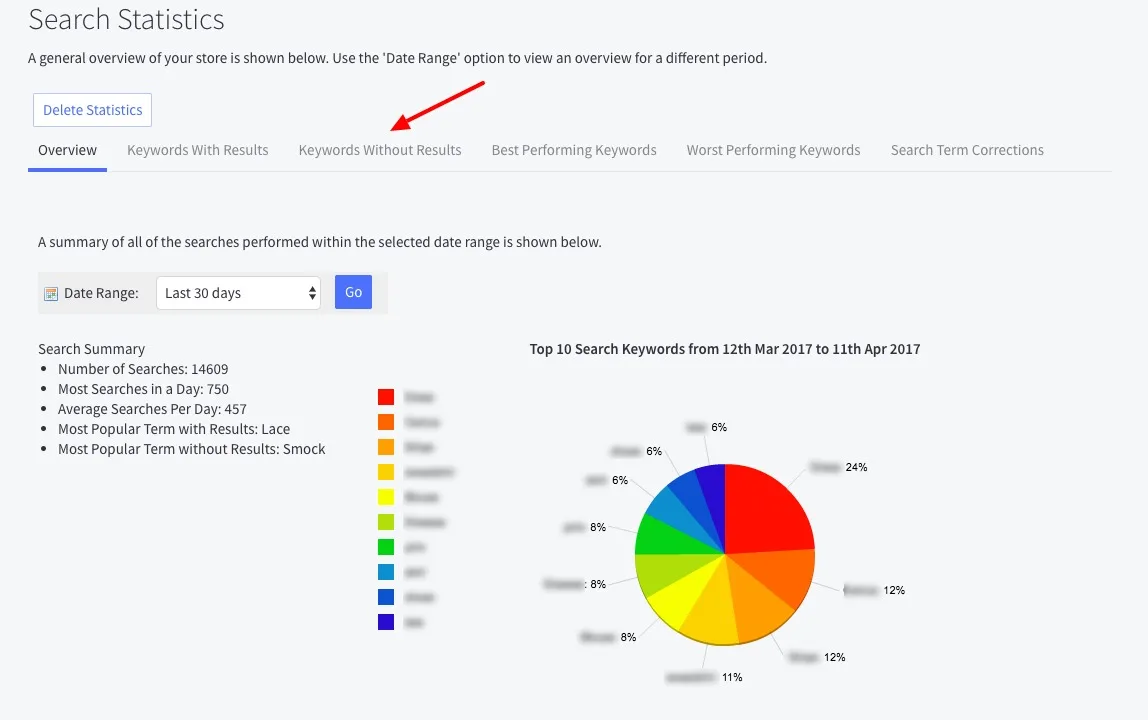
Look at keywords your potential customers are searching for that *are not* showing up. This can help you determine what you need to add into the store, for example.
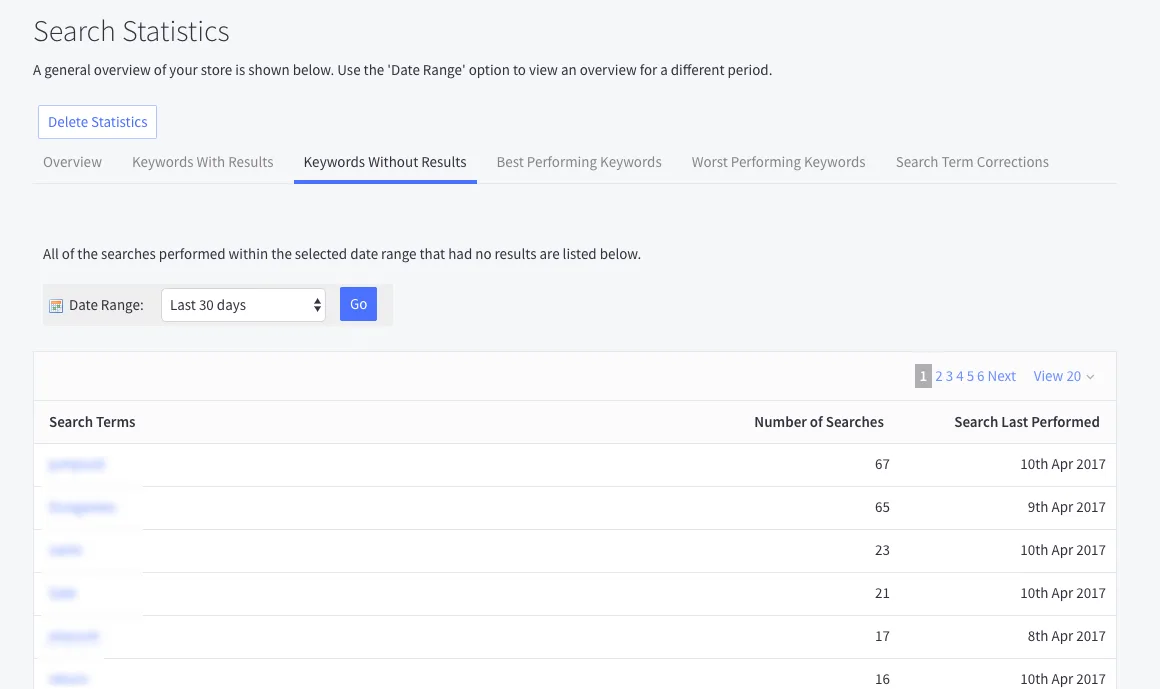
These reports give you access to visitor interaction information to figure out where your website is lacking or excelling based on the products people are looking for (and the language they are using) on your site.
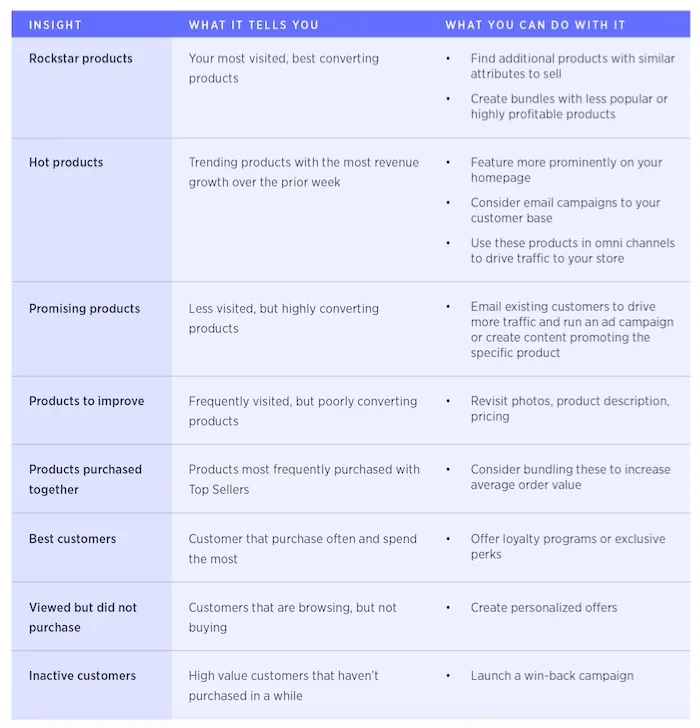
BigCommerce Insights Actionable Chart
Finally, here is a quick hit chart for anyone who has just begun to use Insights and wants to think through how to act on that data.
Final Word
At the end of the day, Ecommerce Analytics and Insights reports help you to sell more, more strategically than ever before. The goal is to increase conversions, which is why the conversion rate on your analytics dashboard is so prominent.
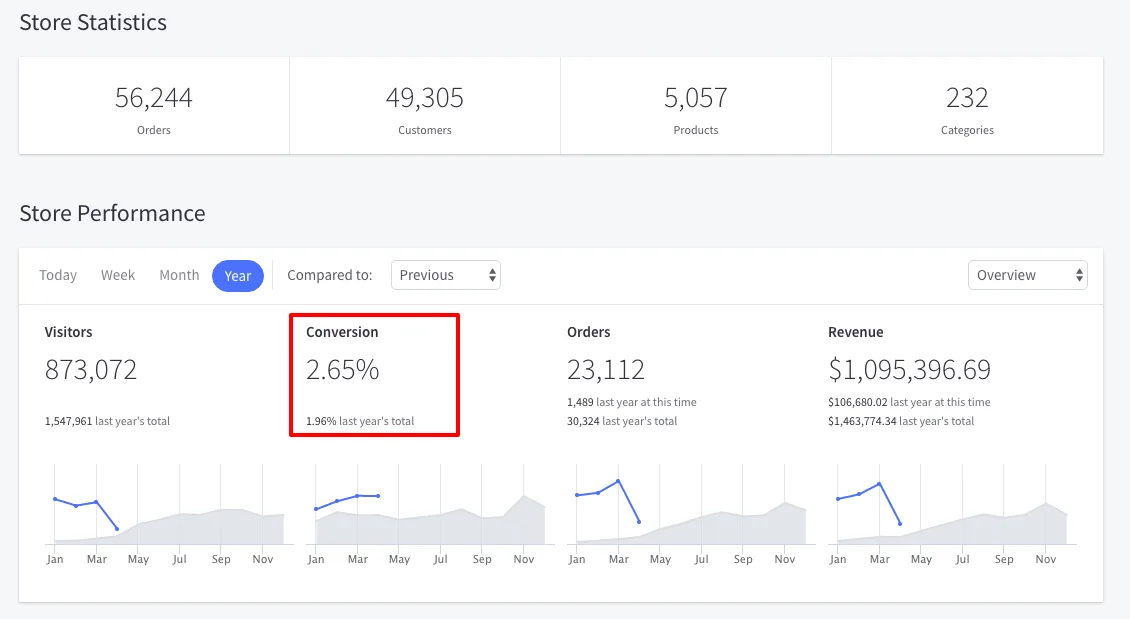
BigCommerce tracks your store’s conversion rates day-over-day, week-over-week, month-over-month, quarter-over-quarter, year-over-year and in any customizable way you want to see it.
After all, our goal is to help you sell more and future-proof your business.
The analytics within BigCommerce are really helpful. It’s so good to be able to compare month-to-month, week-to-week, and to see the conversions over time.
We had one company reach out to us and say, ‘We can get you a decent conversion rate for your industry, something at about 2.3%.’ I told them, ‘That’s great. We’re already getting 4.6%.’ There was silence. They didn’t know what to say.
It was BigCommerce’s Ecommerce Analytics that enabled us to put up a counter argument. BigCommerce had all the statistics laid out right there in front of us. We were able to quote them minute by minute in real time, what our conversion rate was this day for last week, last month and last year.
Get Started Now
All BigCommerce customers have free access to 11 out-of-the-box ecommerce analytics reports. Details are here for pricing on the additional 18 Insights reports.

Tracey is the Director of Marketing at MarketerHire, the marketplace for fast-growth B2B and DTC brands looking for high-quality, pre-vetted freelance marketing talent. She is also the founder of Doris Sleep and was previously the Head of Marketing at Eterneva, both fast-growth DTC brands marketplaces like MarketerHire aim to help. Before that, she was the Global Editor-in-Chief at BigCommerce, where she launched the company’s first online conference (pre-pandemic, nonetheless!), wrote books on How to Sell on Amazon, and worked closely with both ecommerce entrepreneurs and executives at Fortune 1,000 companies to help them scale strategically and profitably. She is a fifth generation Texan, the granddaughter of a depression-era baby turned WWII fighter jet pilot turned self-made millionaire, and wifed up to the truest of heroes, a pediatric trauma nurse, who keeps any of Tracey’s own complaints about business, marketing, or just a seemingly lousy day in perspective.
